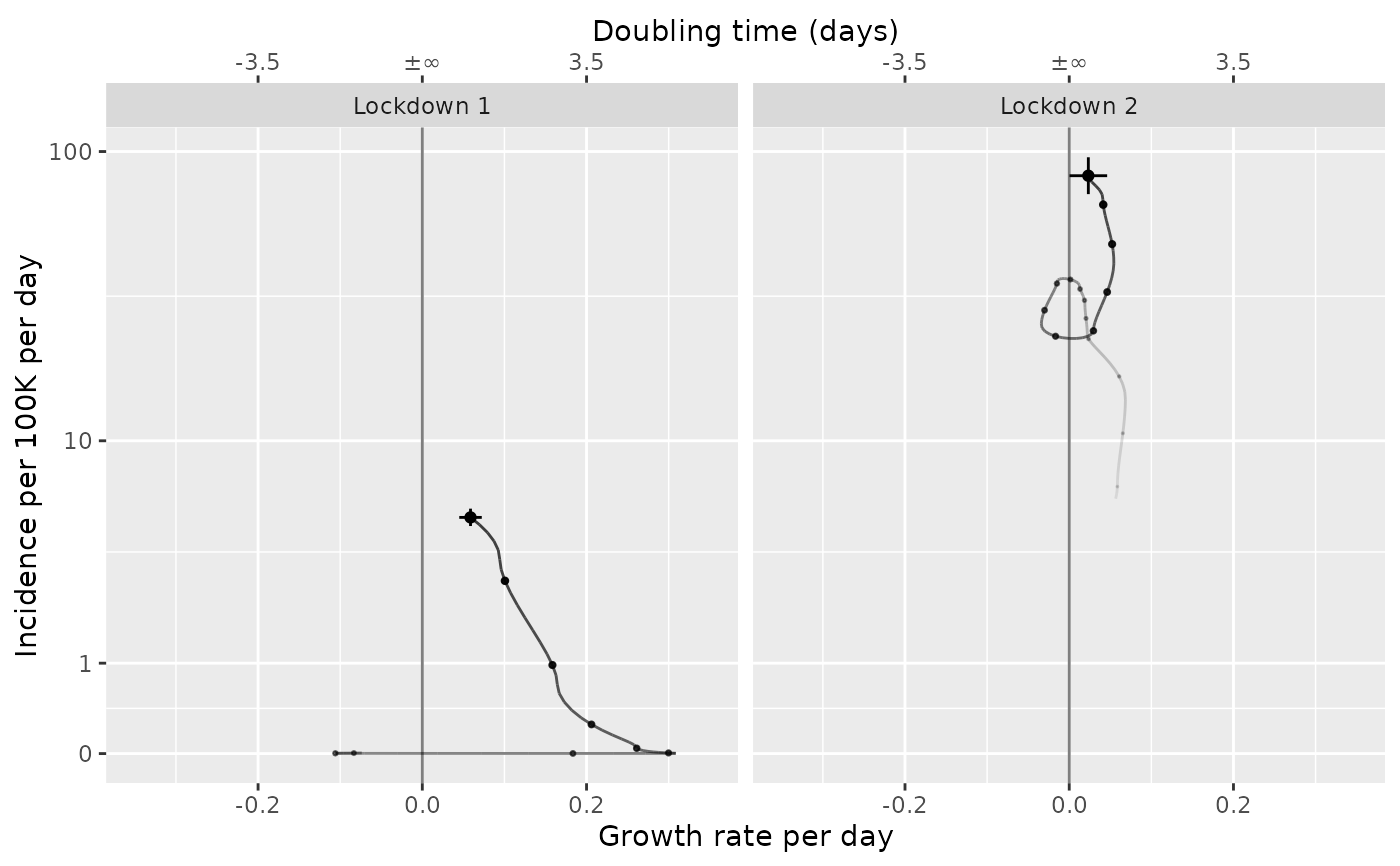
Plot an incidence or proportion vs. growth phase diagram
Source:R/plot-growth-phase.R
plot_growth_phase.RdPlot an incidence or proportion vs. growth phase diagram
Usage
plot_growth_phase(
  modelled = i_timestamped,
  timepoints = NULL,
  duration = max(dplyr::count(modelled)$n),
  interval = 7,
  mapping = if (interfacer::is_col_present(modelled, class)) ggplot2::aes(colour = class)
    else ggplot2::aes(),
  cis = TRUE,
  ...
)
Arguments
- modelled
Either:
A dataframe containing the following columns:
time (as.time_period + group_unique) - A (usually complete) set of singular observations per unit time as a
time_periodincidence.fit (double) - an estimate of the incidence rate on a log scale
incidence.se.fit (double) - the standard error of the incidence rate estimate on a log scale
incidence.0.025 (positive_double) - lower confidence limit of the incidence rate (true scale)
incidence.0.5 (positive_double) - median estimate of the incidence rate (true scale)
incidence.0.975 (positive_double) - upper confidence limit of the incidence rate (true scale)
growth.fit (double) - an estimate of the growth rate
growth.se.fit (double) - the standard error the growth rate
growth.0.025 (double) - lower confidence limit of the growth rate
growth.0.5 (double) - median estimate of the growth rate
growth.0.975 (double) - upper confidence limit of the growth rate
No mandatory groupings.
No default value.
OR:
A dataframe containing the following columns:
time (as.time_period + group_unique) - A (usually complete) set of singular observations per unit time as a
time_periodproportion.fit (double) - an estimate of the proportion on a logit scale
proportion.se.fit (double) - the standard error of proportion estimate on a logit scale
proportion.0.025 (proportion) - lower confidence limit of proportion (true scale)
proportion.0.5 (proportion) - median estimate of proportion (true scale)
proportion.0.975 (proportion) - upper confidence limit of proportion (true scale)
relative.growth.fit (double) - an estimate of the relative growth rate
relative.growth.se.fit (double) - the standard error the relative growth rate
relative.growth.0.025 (double) - lower confidence limit of the relative growth rate
relative.growth.0.5 (double) - median estimate of the relative growth rate
relative.growth.0.975 (double) - upper confidence limit of the relative growth rate
No mandatory groupings.
No default value.
- timepoints
timepoints (as
Dateortime_periodvector) of dates to plot phase diagrams. If multiple this will result in a sequence of plots as facets. IfNULL(the default) it will be the last time point in the series- duration
the length of the growth rate phase trail
- interval
the length of time between markers on the phase plot
- mapping
a
ggplot2::aes()mapping- cis
should the phases be marked with confidence intervals?
- ...
Arguments passed on to
geom_eventseventsSignificant events or time spans
A dataframe containing the following columns:
label (character) - the event label
start (date) - the start date, or the date of the event
end (date) - the end date or NA if a single event
No mandatory groupings.
A default value is defined.
Examples
# example code

tmp = growthrates::england_covid %>%
  time_aggregate(count=sum(count))

tmp_pop = growthrates::england_demographics %>%
  dplyr::ungroup() %>%
  dplyr::summarise(population = sum(population))

# If the incidence is normalised by population
tmp2 = tmp %>%
  poisson_locfit_model() %>%
  normalise_incidence(tmp_pop)

timepoints = as.Date(c("Lockdown 1" = "2020-03-30", "Lockdown 2" = "2020-12-31"))

plot_growth_phase(tmp2, timepoints, duration=108)