AvonCAP study population denominator
Source:vignettes/web/denominator-check.Rmd
denominator-check.RmdMr James Campling MSc1; Dr Robert Challen MBBS PhD2
- Vaccines Medical Affairs, Pfizer Ltd, Tadworth, UK, KT20 7NS.
- Engineering Mathematics, University of Bristol, UK
Background
The AvonCAP study is based on 2 acute hospitals in Bristol. These are the Bristol Royal Infirmary (BRI) and Southmead hospital. BRI is part of the University Hospitals Bristol And Weston NHS Foundation Trust (UHBWFT), and Southmead is part of North Bristol NHS trust (NBT). University Hospitals Bristol And Weston NHS Foundation Trust also includes Weston General Hospital which is not part of the study. Both of these trusts are part of the Bristol, North Somerset and South Gloucestershire Integrated Care Board (BNSSG ICB) (previously a Clinical Commissioning Group).
The purpose of this supplementary paper is to compare different methods for estimating the study catchment area, and population denominator, to assess the effect of the ageing population over the study period, and to create time varying estimates of population denominator that take into account population trends over the study period.
Methods
Proportional flow - aLRTD admissions / General practice populations
The catchment area of the AvonCAP study was previously estimated [1] using a proportional flow model linking GP surgeries within the BNSSG ICB to study hospitals based on the proportion of patients presenting with acute lower respiratory tract disease (aLRTD) from each surgery that attended a study hospital between 2017 and 2019, stratified by age. This also collected some information on patients in the BNSSG with aLRTD who go to non-study hospitals such as Weston General.
In brief, hospital admission data were linked to aggregated GP practice patient registration data within BNSSG Clinical Commissioning Group for 2017–2019. The proportion of GP practices’ aLRTD hospitalisations that occurred at a specific study hospital was multiplied by their patient registration count for six age groups to obtain each practices’ contribution to that hospital’s denominator (e.g., if 50% of GP practice admissions were at a specific study hospital among individuals aged 50−64y, the practice contributed half of their patients aged 50–64y to the denominator).
The registered population of all general practices is available from NHS England [2] and the population from October 2019 is used as the baseline population. Due to patients who are admitted to both study hospitals within the 2017-2019 time period there is minor amount of double counting in this method which is pragmatically addressed by truncating the combined proportion of the 2 study hospitals to 1.
| trust | hosp | 18-34 | 35-49 | 50-64 | 65-74 | 75-84 | 85+ |
|---|---|---|---|---|---|---|---|
| NBT | Southmead Hospital | 1090 | 1335 | 2780 | 3355 | 4345 | 3935 |
| UHBWFT | Bristol Royal Infirmary | 830 | 1300 | 2265 | 2320 | 2800 | 2040 |
| Weston General Hospital | 46 | 91 | 240 | 430 | 680 | 790 | |
| Other | Other | 26 | 42 | 99 | 134 | 134 | 138 |
Proportional flow - NHS Trust Emergency admissions / Middle super output areas
In 2022 the Office of Health Inequalities and Disparity (OHID) produced another proportional flow model linking Middle Super Output Area (MSOA) small scale geographical areas to NHS trusts. This included the NHS Trusts that run the study hospitals, and it used hospital episode statistics describing general or emergency hospital admissions stratified by age and sex [3].
Adapting the OHID model to get an estimate of the AvonCAP study population is made difficult by the fact that there is not a 1:1 relationship between NHS trusts and the study hospitals. We used the admissions data collected during development of the aLRTD model to generate scaling factors that relate the proportion of admissions in an NHS trust to the admissions in the study hospitals stratified by age. This can be used to attribute the estimated catchment area of the NHS trusts from the OHID model to that of the AvonCAP study hospitals, by scaling down the University Hospital Bristol NHS trust estimate to account for patients that go to Weston General rather than Bristol Royal Infirmary.
The OHID data is published by 5 year age group. This is interpolated and aggregated to the age bands in the AvonCAP study. As aLRTD admissions are typically emergencies we focus on the OHID catchment area based on emergency admissions; the OHID model includes all forms of emergency admission and is not specific to aLRTD.
| trust | hosp | 18-34 | 35-49 | 50-64 | 65-74 | 75-84 | 85+ |
|---|---|---|---|---|---|---|---|
| NBT | Southmead Hospital | 100.0% | 100.0% | 100.0% | 100.0% | 100.0% | 100.0% |
| UHBWFT | Bristol Royal Infirmary | 94.7% | 93.5% | 90.4% | 84.4% | 80.5% | 72.1% |
Label propagation
Challen et at. (2022) [4] developed a method for estimating catchment areas using label propagation that takes as input the number of beds in all hospitals and the population sizes of small geographical regions to estimate a catchment area at the level of individual hospitals, by optimising supply (beds) and demand (population).
This is able to generate a catchment area for the two study hospitals without including Weston General Hospital, and uses ONS population data from 2019 and hospital bed capacity data from the COVID pandemic.
The label propagation method is not specific to age group or condition, and the catchment population is simply all people within a geographic area.
Projecting forwards
The ONS publishes population projections for the UK at different levels of granularity. Regionally the population of the South West was projected to grow by 0.9% in 2021 and 2022 [5]. Age stratified populations are also influenced by the ageing of the “baby boomer” generation, with particular growth expected in the 75-84 age group. Projections are based on 2019 population data, and do not take account of the COVID-19 pandemic. GP registration data is available [2] which describes the demographics of each practice on a monthly interval. This can also be used to describe population trends retrospectively.
Although the aLTRD proportional flow method described above [1] represents the population of individual GP surgeries, and could in theory be used to track the demographic changes in individual surgeries aver time, this is not simple as over the study several GP practices have merged and become a single entity. There is no easy way to track the proportional flow of patients from merged practices, and hence correctly distribute the proportions from old to new.
The simplifying assumption has been made that age stratified population trends in the aggregate of GP surgeries within the BNSSG ICB, is representative for the population trends in the study hospitals. We therefore use the relative trends in GP registration details for all practices in the BNSSG ICB to scale the baseline 2019 estimated catchment population of the study hospitals using any of the 3 estimation methods above.
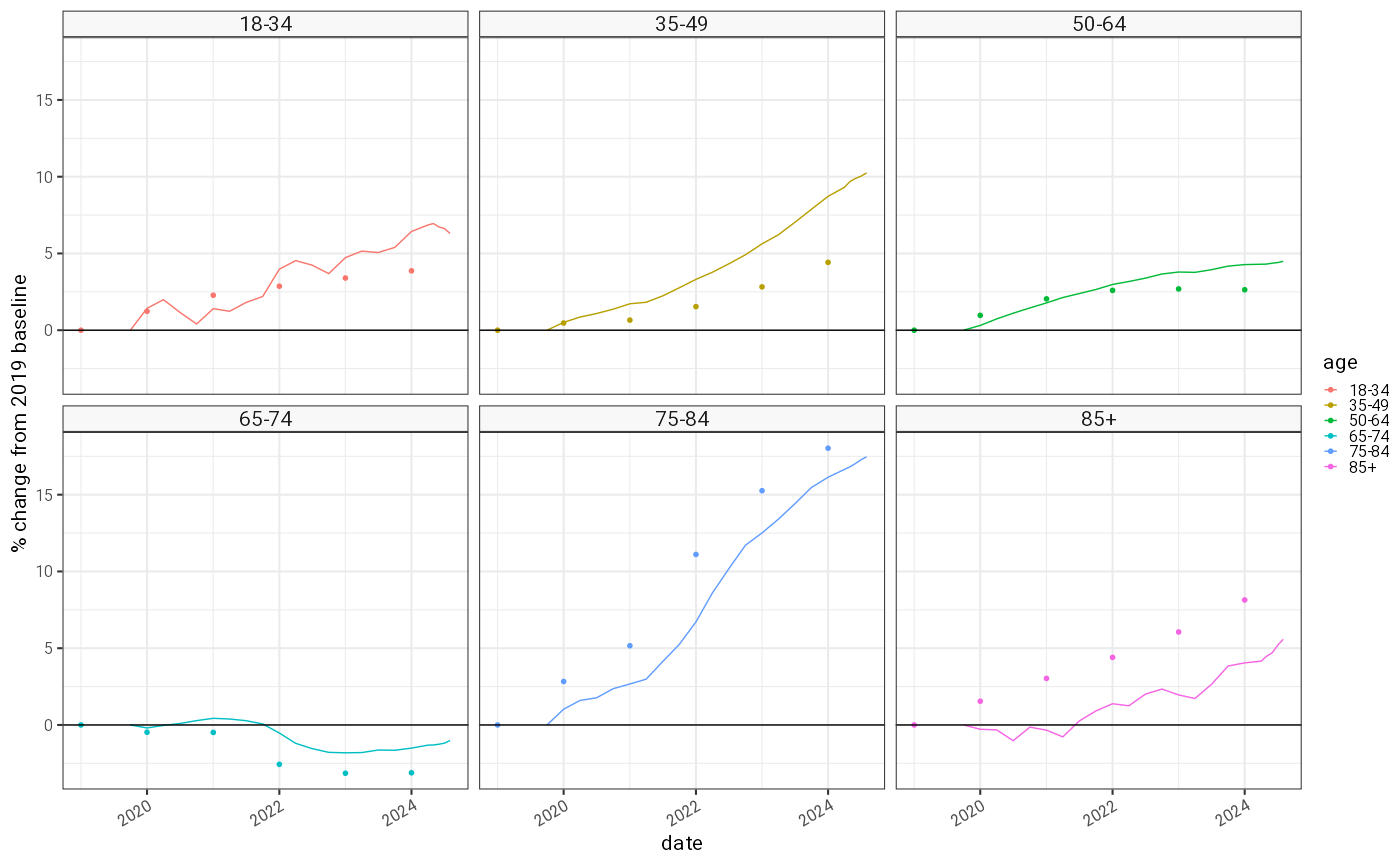
Real time GP registrations (solid line) and ONS population projections based on 2018 data (points) for the AvonCAP study period as a percentage change from the 2019 baseline. ONS estimates do not take into account the effects of the COVID-19 pandemic
The age stratified relative population increases shown here have some statistical noise and in the younger age groups some seasonality is visible despite the resolution of the data being 3 monthly. ONS data is plotted for comparison and suggests over-estimation in older age groups compared to younger. This could be the result of the pandemic. From this data, and the initial 2019 populations estimated using the 3 methods, an age stratified daily denominator that spans the whole study period is generated using a locally fitted polynomial with span 0.75 and degree 2 [6].
Results
Of the 3 models the aLRTD proportional flow model (Campling 2019) and the label propagation models (Challen 2019) generate catchment populations of very similar sizes, but with moderately different population composition. The OHID emergency admissions proportional flow model produces a catchment population which is overall about 15% larger (4.2% to 24.4% depending on age group) than the aLRTD proportional flow model, which is used here as the referent. The catchment area is used as a denominator in calculations that adjust for population size, and so for example incidence calculations that use the OHID estimates will be smaller than those using the aLRTD proportional flow estimates.
| age_category | Campling 2019 | OHID (exc Weston) 2019: Emergency | Challen 2019 |
|---|---|---|---|
| 18-34 | 231342 | 266878 (+15.4%) | 239831 (+3.7%) |
| 35-49 | 184269 | 192017 (+4.2%) | 170054 (-7.7%) |
| 50-64 | 152380 | 182638 (+19.9%) | 150630 (-1.1%) |
| 65-74 | 74245 | 92374 (+24.4%) | 78745 (+6.1%) |
| 75-84 | 45989 | 55243 (+20.1%) | 48048 (+4.5%) |
| 85+ | 19229 | 22070 (+14.8%) | 20729 (+7.8%) |
| ALL | 707454 | 811220 (+14.7%) | 708037 (+0.1%) |
The principal cause for this difference can be seen in a map of the OHID proportional flow versus the boundaries of the BNSSG ICB. Emergency admissions to the NHS trusts containing the study hospitals arise from the wide area across the South West of England due to their role as a tertiary referral centres. The aLRTD proportional flow model excludes GP surgeries outside of the BNSSG ICB region; these were reported to contain less than 5% of the aLTRD admissions to the study hospitals. The difference between the 2 models may be explained partly by the less specific range of emergency conditions in the OHID model including tertiary referrals for cardio-thoracic surgery or trauma, which will tend to increase the OHID model estimates, and partly by the aLRTD model being limited to the BNSSG ICB, which will tend to reduce the estimates from the aLRTD model.
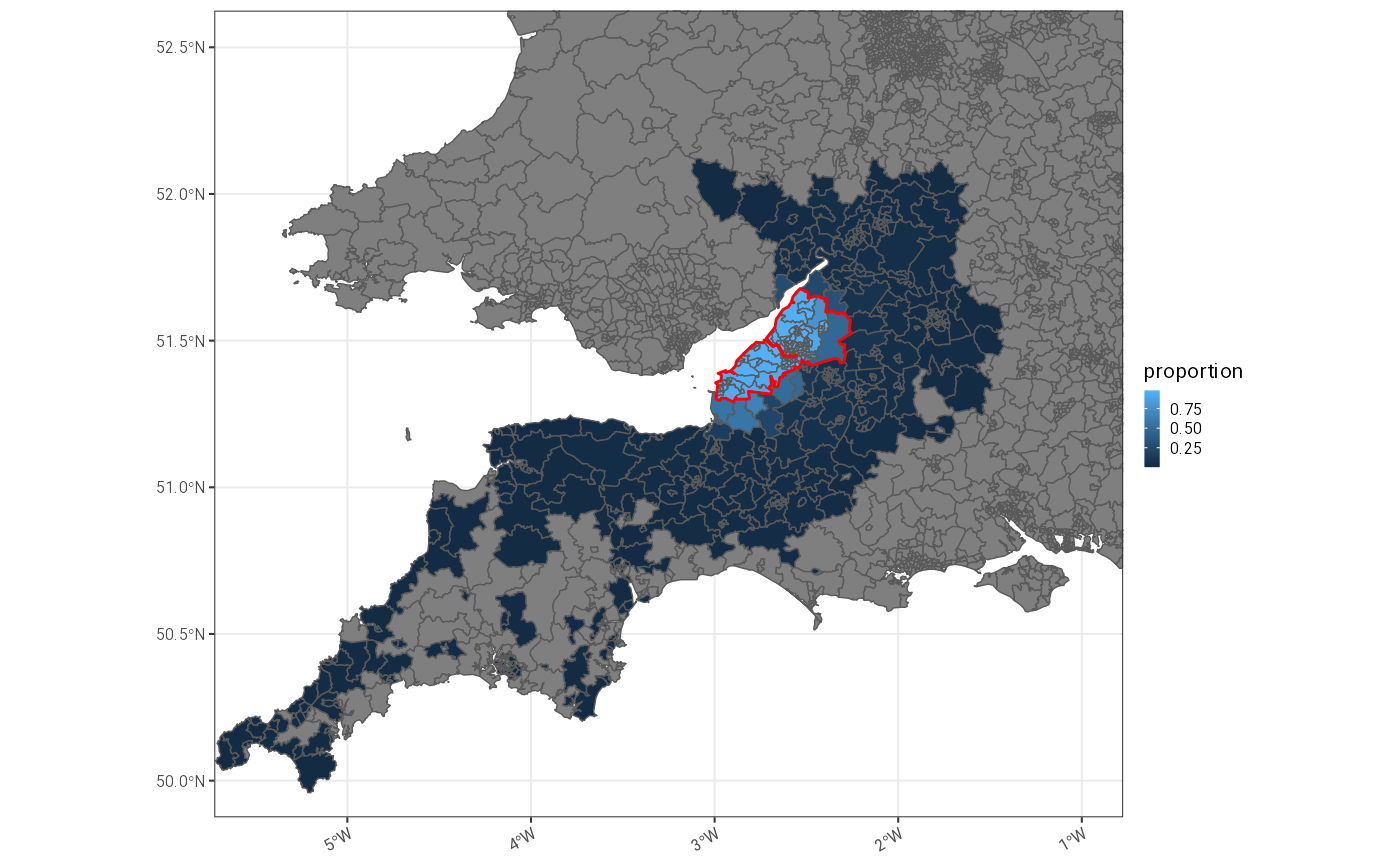
Comparison of geographical extents of OHID proportional flow model (blue shading) and BNSSG ICB boundaries (red), which also mark the maximum extent of the aLRTD proportional flow model.
Changes over time
Using the aLRTD proportional flow model, projecting population trends from the GP registration data onto the 2019 estimates, shows a 5.7% population increase in the study period and implies quite marked shifts in age groupings, particularly with a 15.5% increase in the 75-84 group due to the ageing population.
| age | 2019 | 2020 | 2021 | 2022 | 2023 |
|---|---|---|---|---|---|
| 18-34 | 231342 (+0.0%) | 232275 (+0.4%) | 236423 (+2.2%) | 239867 (+3.7%) | 243823 (+5.4%) |
| 35-49 | 184269 (+0.0%) | 186797 (+1.4%) | 189362 (+2.8%) | 193316 (+4.9%) | 198784 (+7.9%) |
| 50-64 | 152380 (+0.0%) | 154589 (+1.4%) | 156421 (+2.7%) | 157960 (+3.7%) | 158741 (+4.2%) |
| 65-74 | 74245 (+0.0%) | 74455 (+0.3%) | 74295 (+0.1%) | 72920 (-1.8%) | 73021 (-1.6%) |
| 75-84 | 45989 (+0.0%) | 47076 (+2.4%) | 48402 (+5.2%) | 51370 (+11.7%) | 53104 (+15.5%) |
| 85+ | 19229 (+0.0%) | 19202 (-0.1%) | 19405 (+0.9%) | 19679 (+2.3%) | 19967 (+3.8%) |
| ALL | 707454 (+0.0%) | 714394 (+1.0%) | 724308 (+2.4%) | 735112 (+3.9%) | 747440 (+5.7%) |
Interpolation of these shifts allows us to estimate daily denominators, stratified by age group, for each of the 3 different methods over the whole study period. These denominators can be used for calculating population standardised incidence rates. The incidence of disease in the AvonCAP study can be calculated as the daily count of new cases divided by the per day denominator, to give a daily rate per capita. This can then be summed over a year, for example, and multiplied by 1000 to give an incidence per 1000 person years (or 100,000 for estimates per 100,000 per year).
Using the number of daily cases per day as the numerator, and the daily estimated population size as the denominator, a binomial regression model can be fitted with time varying rate to produce a normalised daily incidence rate per capita. This can be multiplied by the number of days in the year and 1000 to produce an instantaneous incidence per 1000 person years. A similar calculation can be done on weekly case counts; for this it is reasonable to assume the per day denominator for the start of the week.
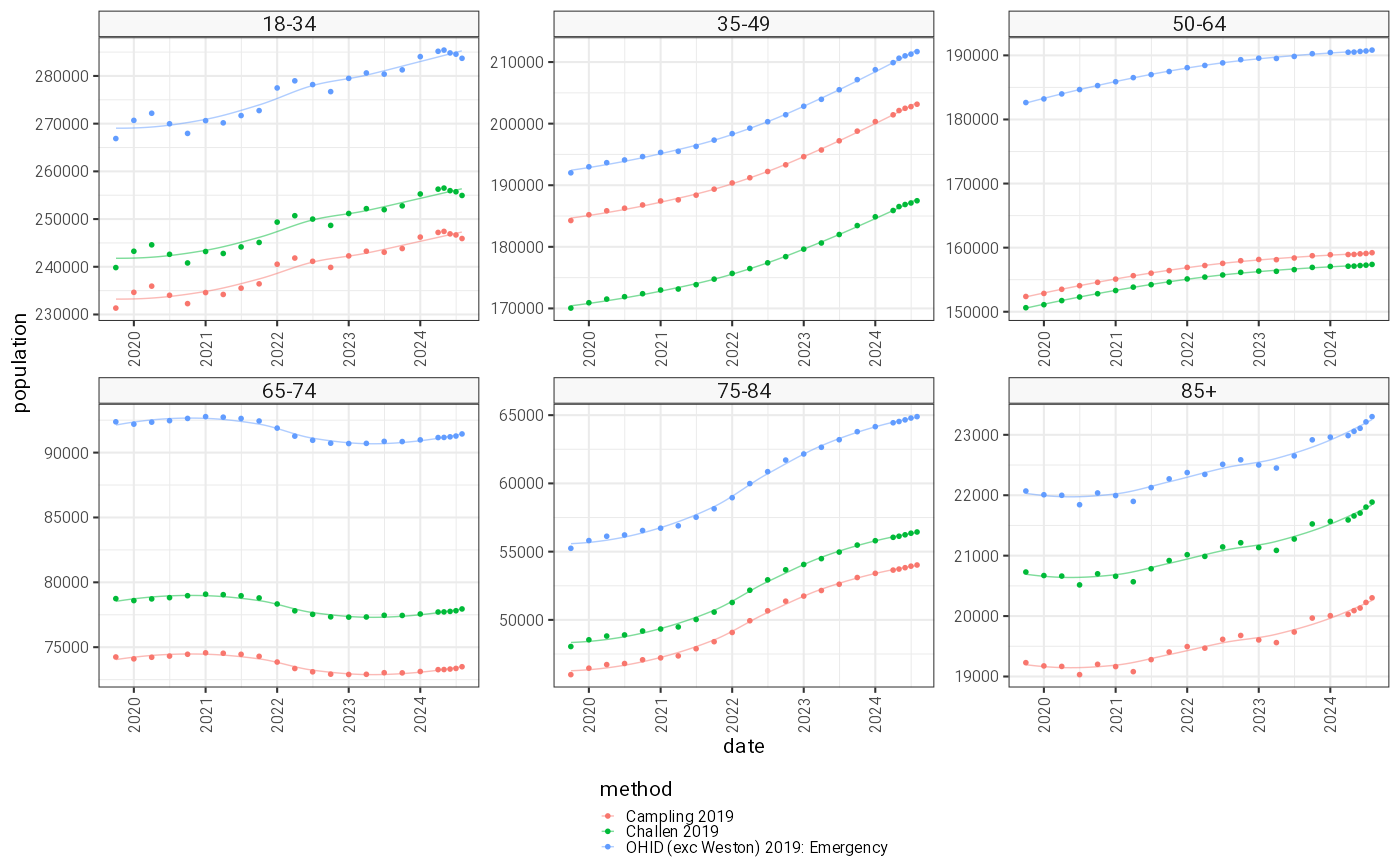
Age group stratified smoothed catchment population estimates over the duration of the AvonCAP study.
Conclusion
We previously reported an aLRTD specific denominator for AvonCAP for the year 2019 [1]. This has the benefit of being specific for the condition central to the AvonCAP study, and therefore should account for the specialist services offered by the study hospitals. For the age group including all adults, this estimate agrees well with those produced by a label propagation algorithm [4], with differences arising in the distribution of ages in the population. The label propagation algorithm does not attempt to account for the differential burden of disease in different age groups and is not condition specific. A third estimate using proportion flow of emergency admissions [3], produces estimates that are somewhat larger than the aLRTD specific denominator. These include admissions from a very wide geographic area, which could represent hospital to hospital transfers into tertiary care facilities based in Bristol, or trauma patients retrieved by helicopter. All estimates based on 2019 will have changed over the AvonCAP study period due to the ageing population of the UK. In this supplementary we present time varying age stratified population size estimates which can be used as a denominator to produce generalisable estimates of incidence. No single population estimate can be proven to be correct, although we think the aLRTD specific estimate is likely to be most accurate for AvonCAP, particularly if we can exclude patients who live outside of the BNSSG ICB. We therefore assume the daily varying, age stratified aLRTD specific population estimates for the AvonCAP denominator.